3.0
MODEL CALIBRATION AND RESULTS
![]()
3.1
Initial depth
For purposes of initializing the simulation, the water surface profile of
the system was assumed to be at the bottom of the canals.
This assumption generated zero initial depths in the canal system.
Thus, all initial rainfall contributed to filling the empty canals.
Using this assumption and implementing the cold restart option that
provides very minimal continuity errors.
Infiltration from pervious areas is computed using the
Horton equation. Its parameters were set to the following values, based on
review of the soil surveys:
Max infiltration rate
2 inch/hour
Min (asymptotic) infiltration rate
0.1 inch/hour
Decay
rate of infiltration
0.00115 sec-1
3.3
Imperviousness percentages
The project area has been subdivided and assigned six different
imperviousness percentages based on the projected 1993 functional population [3]
computed using the New Jersey equation:
I = 9.6 PD (0.53 – 0.0391 log 10 PD)
(3.1)
Where:
I = imperviousness [%]
PD = population density in developed portion
of the urbanized area (persons/acre)
The New Jersey equation generated very low estimates of impervious
percentages therefore alternate estimates were sought.
A literature survey of urban area development suggested appropriate
imperviousness between 5% and 30% for the Cape Coral area.
Only a limited area (751 acres) was designated as high-populated area
corresponding to an imperviousness percentage of 34%.
These values from the literature survey were used in preference to the
New Jersey equation estimates.
The canal Manning’s factors were determined based on the information
and photo documentation received from Lee County Environmental Services.
The n factors used for the channels in tidal reaches of the
conveyances were set as 0.03. Generally these conveyances are wide with minimal
plant growth in the channel. The n
factors in the freshwater channel portion of the conveyances located east of
Nelson Road was set as 0.07. Fresh
water areas tend to be narrower and have more plant growth in the channel than
the tidal portions of channels. From
Nelson Road due west until Weir #11, 13, 14 and 15 the factors were set as 0.06
or 0.05 [1]. For the overland flow
within each subcatchment Manning’s “n” factors are 0.05 for the
impervious portion and 0.20 for the pervious portion.
The XP-SWMM Groundwater option in the present study was used in a less
detailed analysis to evaluate its hydrology, focusing overall on the correct
evaluation of the interflow/base flow contribution in the outflow hydrograph
shape and total volume.
In the City of Cape Coral the aquifer system is comprised of
unconsolidated sand or silty sand deposits interbedded with sandy limestone,
shell fragments, and sandy clay. It
is not under artesian pressure [1],
[2]. The aquifer is reported
to be approximately 20 feet thick and is under-laid with a thick (59 feet or
more) layer of sandy clay. Its
hydraulic conductivity varies due to lithologic changes.
Results found in literature indicate that the hydraulic conductivity
ranges from 10-5 and 2*10-2 feet/sec.
The higher values would indicate sand deposits, while the lower values
would indicate limestone (References
[4]).
The water level in this aquifer rises in response to recharge
by local rainfall and seepage from the extensive network of drainage canals.
The levels fall in response to losses by evapotranspiration and seepage
into the canals, the Caloosahatchee River, and the Bay.
Recharge of this aquifer by vertical percolation of rainwater is
inhibited in many of the undeveloped and undisturbed parts of Cape Coral because
of layer of silt and clay, which exist in places at very shallow depths.
This results in areas with locally perched water tables from which much
of the rainfall is lost to evapotranspiration rather than infiltration to the
water table aquifer.
Groundwater movement is generally radial flow in the Cape Coral area,
with flow moving to the west towards Matlacha Pass, and flow directions to the
south and east towards the Caloosahatchee River, the canal system, and again
Matlacha Pass [4].
Groundwater elevations vary within the watershed. Adjacent to the main
canals and their tributaries, water levels are low. This provides for well-drained soil conditions.
This well-drained condition is evident from the dry conditions near the
canals. Localized ponding of water
is often attributable to the fine grain soils rather than an overall high water
table. The localized ponding is
usually of short duration, typically less than six hours.
Wet season water levels farther from the canal, including the area east
of U.S. 41, are close to the ground surface as expected.
This is especially true in the areas that are not developed with canals
and have not had land elevations raised [1].
In the present study the water table was assumed to be 2.0 feet below the
natural ground level, to run a steady state groundwater outflow calibration.
The groundwater rate that can be withdrawn from the water table aquifer
into the canal system by horizontal seepage has been evaluated according to the
Dupuit-Forchheimer formula resulting from a head differential of 2.5 feet
between the furthermost area of the sub basins and the canals, a distance of
approximately ¼ mile.
Vertical percolation is more effective than seepage from the canals in
reaching the water table aquifer. The
potential rate of this vertical percolation is up to 5 cfs/acres. The canal system, however, has a potential recharge rate of
less than 0.01 cfs/acre with a head of 1 foot [2].
There are tributary conveyances on the north side of the Gator Slough
canal. These conveyances have no control structures to maintain water levels.
The net effect is to expand the overdrained areas that exist adjacent to
the main canal. Control structures on these and future connections to the canal
could be designed to minimize the area of overdrainage.
The City of Cape Coral Utility Master Plan Update, Final Report
prepared by Dames & Moore in association with Black and Veatch August 1999
[4], describes a groundflow simulation performed in the area.
The MODFLOW model results presented in the report have been used as a
calibration target to fix the groundwater parameters of the XP-SWMM options.
The Dames & Moore model showed that the base flow attainable rate
would vary from 43 to 62 cfs. The
XP-SWMM model has finally reached the amount of a constant 50 cfs during the
simulated period (September, 1996).
Groundwater discharge represents lateral flow from the saturated zone to
the receiving water. The Dupuit Forcheimer flow equation takes on the following
general form (with reference to Figure. 8):
![]() (cfs
per linear foot of canal)
(3.2)
(cfs
per linear foot of canal)
(3.2)
where
K
= hydraulic conductivity (range 10-5 to 2*10-2 feet/sec)
L
= maximum flow distance at the upstream end of the aquifer
L
is determined by the average distance of the canals reaches, and is set
to
about 0.25 mile
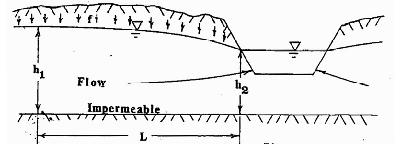
Figure 8. Definition sketch for
Dupuit-Forcheimer approximation for
drainage to adjacent channel.
The
XP-SWMM general groundwater equation takes the form:
![]()
![]() (3.3)
(3.3)
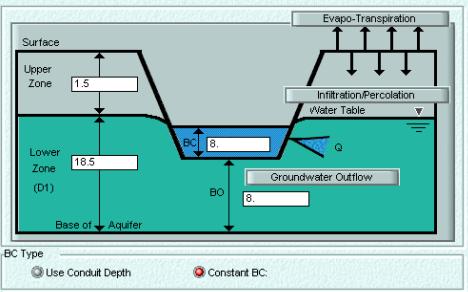
Figure 9. XP-SWMM sketch for the
groundwater component.
Comparison
of equations (3.2) and (3.3) gives:

To route the groundwater simulation it is necessary to enter the name of
the node or conduit to where groundwater from this subcatchment will drain.
The drainage name may or may not be the current node name. In the model
the rate of ground flow coming from each single subcatchment (node) is chosen to
drain in the subcatchment itself. A
summary table with the complete set of groundwater data is provided in Table 3.
|
Parameter |
Unit |
Used |
|
in |
0.2 |
|
|
Upper
zone |
ft |
1.5 |
|
Lower
zone D1 |
ft |
18.5 |
|
Elevation
of channel base BO |
ft |
8 |
|
Water
depth BC |
ft |
8 |
|
Ground
water flow coefficient A1 |
- |
5*10-5 |
|
Ground
water flow exponent B1 |
- |
2 |
|
Channel
water influence coefficient A2 |
- |
5*10-5 |
|
Channel
water influence exponent B2 |
- |
2 |
|
Ground
water/Channel water coefficient A3 |
- |
0 |
|
Wilting
point |
- |
0.05 |
|
Field
capacity |
- |
0.1 |
|
Fraction
of max. ET assigned to upper zone |
- |
0.5 |
|
Max.
depth of significant lower zone transpiration |
ft |
3.3 |
|
Saturated
hydraulic conductivity |
in/hr |
2 |
|
Porosity
expressed as a fraction |
- |
0.3 |
|
Curve
fitting parameter |
- |
20 |
|
Initial
upper zone moisture expressed as a fraction |
- |
0.29 |
|
Coefficient
of unquantified losses |
in/hr |
0 |
|
Average
slope of tension vs. soil moisture curve |
ft/fraction |
128 |
The Cape Coral City canals system bounded by the Lee-Charlotte County
line on the north limit and by Pine Island road to the south, flows through
Basins 1, 2, 3, 4, 5, 6, 7, 8, 9, and 10 eventually discharging to the North
Spreader Canal System. The spreader
system is composed of saltwater canals not used for the City withdraws because
of the high salinity and the detrimental impact this type of water has on the
vegetation. It originally was a
body of fresh water isolated from salt water by a berm between the waterway and
the saline Matlacha Pass. However, breaches and channels in the berm currently
allow salt water to flow from the Pass to the waterway [4].
The Spreader Canal System was designed to intercept discharge of
freshwater from the Cape Coral network. The
main objective of the waterway is to prevent point discharge of the canal
network into the mangrove fringe along the west and southwest coastline of Cape
Coral, distributing the canal discharges over all the existing mangroves.
The mangroves were to be maintained by the waterway providing sheet flow
through existing tidal wetlands.
Other purposes of the Spreader are to provide additional salinity control
for the canals which discharge into it and to maintain higher groundwater
elevations upstream during the dry season [2].
The existing Spreader Canal consists of the North Spreader
Waterway to the north of Pine Island Road, taken into account in this study, and
the South Spreader Waterway to the south of Pine Island Road.
Both systems are physically separated and can be considered to be
distinct entities [4].
Breaks exist in the berm that separates the waterway from the Matlacha
Pass. Currently, saltwater flows through these breaks from the pass to the
Spreader System. Therefore
downstream of Burnt Store Road, in the North Spreader Waterway, the conveyance
is controlled by the same tidal conditions of Matlacha Pass, also considering
the capacity of the perimeter canal system in the Cape Coral and connections
seaward, and it was assumed the water elevations would be similar to those in
Matlacha Pass station. Each of the
four main canals of the network has a weir along Burnt Store Road: Weir 11
(Gator Slough Canal), 13 (Horseshoes Canal), 14 (Hermosa Canal) and 15 (Shadroe
Canal).
Matlacha Pass tide level historical information was provided by Lee
County Environmental Services-Natural Resources Division, Florida Department of
Environmental Protection and the U.S. Department of Commerce-National Oceanic
and Atmospheric Administration National Ocean Service.
The model has been assigned a constant Mean High Water Level over the
full period of the calibration event. The
unique node (#1756) assigned with the Outfall option and a “User Stage
History” is located in the last southwest most position.
The level is taken from the Tidal Bench Mark “Matlacha Pass”
(Latitude: 26o37.9’N, Longitude: 082o04.1’W, USGS
Quad: Matlacha). The calibration
event (1 year Return Interval) has been assigned with a tide elevations of 2.0
feet NGVD. The project events (5,
25, 100 years Return Interval) were assigned with a tide elevations of 2.7 feet
NGVD. The backwater analysis only
accounts for conditions created by the design rainfall events.
The only data available for calibration and verification was for the
Gator Slough canal watershed.
Insufficient data were available for Horseshoe, Hermosa and Shadroe
canals. Therefore the conceptual
methodology adopted to calibrate the model has been to use one year of data for
only one sub watershed, the Gator Slough canal watershed, and assume that the
calibrated parameters are applicable to other basins.
Upstream inflow to Gator Slough originating from the portion of the
watershed located north and east at U.S. 41 (33 square miles undeveloped
watershed of wildlife management area) are inserted as a “User Inflow” input
in node 31 of the model. Data are
from gauging station located 0.5 miles west of U.S. 41, named Gator Slough at
US 41 near Ft. Myers, FL.
The period selected for model calibration includes 24 days from September
5th to 28th, 1996. This
is consistent with the 1-year return interval (RI) event selected based on
Gumbel statistical analysis performed over the outflow historical period of
record for Weir #11, downstream of Gator Slough Canal.
The peak Gumbel 1-year RI flow for this section is 42 cfs (daily average
value)
3.8
Evaporation and Rainfall Data
The Southwest Florida Research and
Education Center, part of the University of Florida's Institute of Food and
Agricultural Sciences, presents information on both the Total Pan Evaporation
and the total Penman Evaporation, in the form of average monthly values for
each month of the period from 1989 to 1997.
Evaporation data requested as an input by the Runoff mode of the model
act also as an upper bound for evapotranspiration losses from groundwater and
soil moisture. The Total Penman
ET values inserted are summarized in the following Table:
Table
4. Total Penman ET (inches).
Monthly values.
|
Jan |
Feb |
Mar |
Apr |
May |
Jun |
Jul |
Aug |
Sep |
Oct |
Nov |
Dec |
|
3.49 |
4.20 |
5.56 |
5.37 |
5.77 |
5.46 |
5.71 |
5.45 |
5.02 |
4.69 |
4.04 |
3.59 |
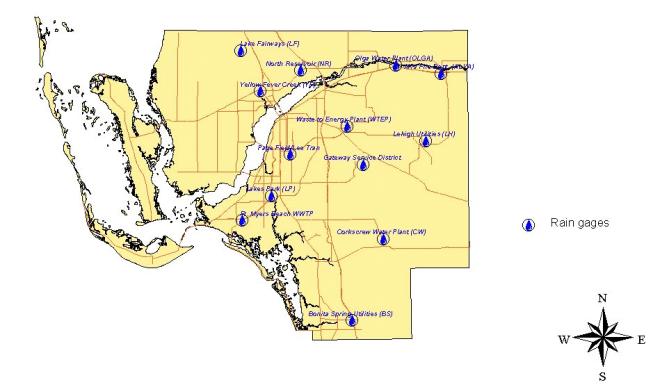
Figure 11 below gives the various locations in Lee County where rain
gages are installed. Rainfall
data used for the calibration was obtained from the gauging station of Lake
Fairways (0.5 miles west of the bridge of U.S. 41 on the Gator Slough provided
by Lee County, see Figure 12). The
period of record covers 24 days from 5th to 28th
September 5th, to be consistent with the 1-year RI event selected
based on the Gumbel statistical analysis run over the outflow historical data
of Weir 11, downstream of Gator Slough Canal. Data on storm paths is
not readily available for the Cape Coral area.
The local storms for the most part travel inland from the coast.
The rain has been considered homogeneous over the whole watershed. The total amount of rain over the 24 days period is 8.39 inches.
Reference: Lee County Regional Water Supply Authority.
Figure
12. Cumulative
Rainfall: September 5-28, 1996 (Gauge Station: Lake Fairways,
0.5 mile west of U.S. Hwy 41).
3.9
Outflow Data and Statistical Analysis
The main criteria used in selecting the
calibration period of record was the Gumbel statistical analysis applied to the
outflow data for the station located near S.R. 765, corresponding to Weir #11.
The analysis was conducted for Weir #11 outflow data to identify that
period of record most closely matching a 1-year RI runoff event and for which a
concurrent rainfall record and upstream inflow record were also available.
The annual maximum flood flow value, in
daily mean series, detected in a water stream section, is an extreme event.
Since the watershed was not submitted to relevant hydrologic modifications
during the period of years under analysis, those series can be treated as
homogeneous and independent values. These conditions allow us to associate the
probable frequency and then the return interval to a given discharge event and
to apply those values to the statistical analysis methods. Gumbel analysis has been proved to be one of the most
reliable methods for hydrologic series. A
double exponential probability distribution allows assignment of an expected
flow rate for all return periods.
The U.S. Geological Survey monthly maximum
values of daily average discharge on S.R. 765 corresponding to Weir #11 are
shown in Table 5.
Table
5. USGS monthly maximums of
discharge (cfs) for location:
264139082022100 Gator Slough at SR 765 Near Fort Myers, FL.
|
Year |
Jan |
Feb |
Mar |
Apr |
May |
Jun |
Jul |
Aug |
Sep |
Oct |
Nov |
Dec |
Max |
|
1984 |
|
|
|
|
86 |
236 |
290 |
191 |
89 |
60 |
35 |
10 |
290 |
|
1985 |
11 |
8 |
8 |
2 |
0 |
2 |
88 |
154 |
286 |
139 |
182 |
16 |
286 |
|
1986 |
16 |
5 |
27 |
8 |
5 |
478 |
114 |
842 |
407 |
72 |
34 |
39 |
842 |
|
1987 |
108 |
22 |
172 |
147 |
152 |
143 |
308 |
185 |
131 |
595 |
77 |
28 |
595 |
|
1988 |
13 |
12 |
33 |
17 |
10 |
5 |
262 |
273 |
507 |
47 |
77 |
11 |
507 |
|
1989 |
27 |
8 |
22 |
5 |
10 |
118 |
245 |
504 |
204 |
54 |
18 |
4 |
504 |
|
1990 |
7 |
10 |
8 |
5 |
175 |
135 |
97 |
173 |
54 |
30 |
8 |
3 |
175 |
|
1991 |
139 |
25 |
24 |
13 |
177 |
359 |
604 |
133 |
91 |
117 |
16 |
7 |
604 |
|
1992 |
5 |
20 |
30 |
21 |
9 |
740 |
378 |
321 |
165 |
108 |
10 |
12 |
740 |
|
1993 |
29 |
29 |
279 |
30 |
23 |
191 |
145 |
121 |
126 |
101 |
117 |
14 |
279 |
|
1994 |
14 |
16 |
24 |
118 |
40 |
14 |
123 |
136 |
443 |
84 |
29 |
21 |
443 |
|
1995 |
42 |
15 |
19 |
43 |
70 |
633 |
951 |
1240 |
499 |
594 |
81 |
4 |
1240 |
|
1996 |
46 |
6 |
18 |
15 |
61 |
167 |
125 |
160 |
346 |
573 |
100 |
29 |
573 |
|
1997 |
0 |
0 |
0 |
19 |
27 |
73 |
301 |
531 |
781 |
|
|
|
781 |
Some of the annual series were not
populated with all monthly values. In
these cases an annual event maximum value was taken into account only when the
values for the whole period between June and October were available.
This is because the peak flow rates for all years occurred in this
interval. A return period was then
associated to each of the extreme values as shown in the following Table 6.
|
Order |
Event
Q (cfs) |
Tr |
|
1 |
1240 |
15.00 |
|
2 |
842 |
7.50 |
|
3 |
781 |
5.00 |
|
4 |
740 |
3.75 |
|
5 |
604 |
3.00 |
|
6 |
595 |
2.50 |
|
7 |
573 |
2.14 |
|
8 |
507 |
1.88 |
|
9 |
504 |
1.67 |
|
10 |
443 |
1.50 |
|
11 |
290 |
1.36 |
|
12 |
286 |
1.25 |
|
13 |
279 |
1.15 |
|
14 |
175 |
1.07 |
After the Gumbel analysis it is possible to find out a discharge value
for every given return period as an independent variable (Table 7).
|
Interval |
Q
expected (cfs) |
|
1 |
332 |
|
1.5 |
400 |
|
2 |
523 |
|
5 |
826 |
|
10 |
1027 |
|
15 |
1140 |
|
20 |
1220 |
|
25 |
1281 |
|
30 |
1330 |
|
35 |
1372 |
|
40 |
1409 |
|
45 |
1440 |
|
50 |
1469 |
|
55 |
1495 |
|
60 |
1518 |
|
65 |
1540 |
|
70 |
1560 |
|
75 |
1578 |
|
80 |
1596 |
|
85 |
1612 |
|
90 |
1627 |
|
95 |
1642 |
|
100 |
1656 |
Given the logarithmic nature of the final
Gumbel equation, the 1-year event is obtained from an interpolation trend line
of the other data. Figure 13 shows
the data distribution and the logarithmic trend line used to associate the
discharge value to 1 year.
3.10
Model Calibration Results
September 1996 was selected as the period of record to calibrate the Cape
Coral canals model. The period
selected included all of the following basic data sets for a one-year recurrence
interval storm event were available: (1) Inflow data for the Gator Slough at
U.S. 41 USGS station, (2) Outflow data for the Gator Slough at S.R. 765 USGS
station, and (3) Rainfall data at the Lee County Lake Fairways station.
The one-year recurrence interval event was identified based on Gumbel
statistical analysis of discharge data at S.R. 765.
Thus, the period of record used for the calibration run represents a
documented flow event with a peak near to the statistical one-year recurrence
interval flow magnitude. The
calibration event was not selected on the basis of the one-year rainfall
magnitude.
The historical outflow hydrograph in Figure 15 presents the measured flow
rates from September 5 to September 28, 1996.
The hydrograph rises to a double peak value and recedes to the completion
of the complex event. The duration
of the one-year event used for calibrations purposes was limited to 24 days
(from 5th to 28th of September, 1996) to be consistent
with the requirement that the system achieve the same conditions at the end of
the event as it had at the beginning. The
runoff data for September 1-4 and September 29-30 included either a falling or
rising hydrograph limbs and therefore were eliminated from consideration.
The canal system calibration was also
evaluated by comparison with the Johnson Engineering design water surface
profile along the Gator Slough Canal for the one-year event [1]. The mass
balance is summarized in the Table 8. Figures
14-16 describe the model calibration results. These figures show an
underestimation of total runoff of approximately 10% over the 24-day period when
compared to USGS discharge data. However an internal budget analysis shows
approximately two additional inches of system outputs (runoff + ET) when
compared to system inputs (rainfall + U.S. 41 inflow). This difference is
assumed to be the result of base flow. Table
9 is a comparison of the model calibration results with USGS measured data.
Table 8. Mass balance table
for XP-SWMM calibration event.
|
Gator
Slough Canal Watershed |
|
|
|
1
year event Sep 5-28, 1996 |
|
|
|
Total
Area west of U.S. 41 |
4.0E8 |
ft2 |
|
|
9.1E3 |
acres
|
|
|
|
|
|
|
Volume |
depth
over total area |
|
|
(cubic
feet) |
(inches) |
|
|
|
|
|
Total
Inflow
|
3.3E7 |
1.0 |
|
from
North of U.S. 41 |
|
|
|
|
|
|
|
Tot.
Rain |
2.8E8 |
8.4 |
|
Lake
Fairways station |
|
|
|
|
|
|
|
Total
Infiltration |
1.8E8 |
5.4 |
|
|
|
|
|
Total
ET |
1.3E8 |
4.0 |
|
|
|
|
|
Ground
Flow |
1.1E8 |
3.2 |
|
|
|
|
|
Total
Outflow |
2.4E8 |
7.2 |
|
link
weir # 11, XP-SWMM |
|
|
|
|
|
|
Total Outflow |
|
|
|
S.R.
765 USGS data |
2.6E8 |
8.0 |
|
|
|
|
Missing Runoff |
2.5E7 |
0.8 |
|
Percent
error |
9.6 |
|
|
Runoff,
% of inputs |
52.7 |
|
Table 9. Flow comparison between model calibration results and
USGS measurements at S.R. 765.
|
|
As these distilled results show, the model appears to be performing well.
The record of a single rain station is applied to the whole model area,
whereas much of the regional rainfall occurs as thunderstorms, which strike
unpredictably and locally. Is therefore reasonable to consider acceptable the
20% error in some points of the outflow hydrograph comparison and the mismatch
of the two main event peaks. The
fact that the first event is over predicted and the second event under predicted
suggests that the model performance is correct, on average, and is limited by
rainfall data. The overall
agreement between the calibrated XP-SWMM model and the USGS data were
acceptable. While limited rainfall data make event-by-event comparisons
difficult, agreement over the 24-day period shows a model peak flow of 346 cfs
compared to the USGS measured of 331 cfs, an overestimation of only 4.3%. The
model underestimated discharge volume by 10% (7.2 inches were measured by the
model while USGS measured 8.0 inches).
Figure 16. Gator Slough
calibration: one-year event water elevations comparison.